ONE QUESTION. THREE WAYS IN.
AN ATLAS OF EVERYDAY SYSTEMSEXPLORE · QUESTION · UNDERSTAND
02 / MONEY & BEHAVIOUR
When money
disappears.
Payments keep getting easier. Does that make money easier to understand? Explore the space between convenience and control.
Follow the moneyEURO AREA · PHYSICAL POINTS OF SALE
92%
still acceptcash.
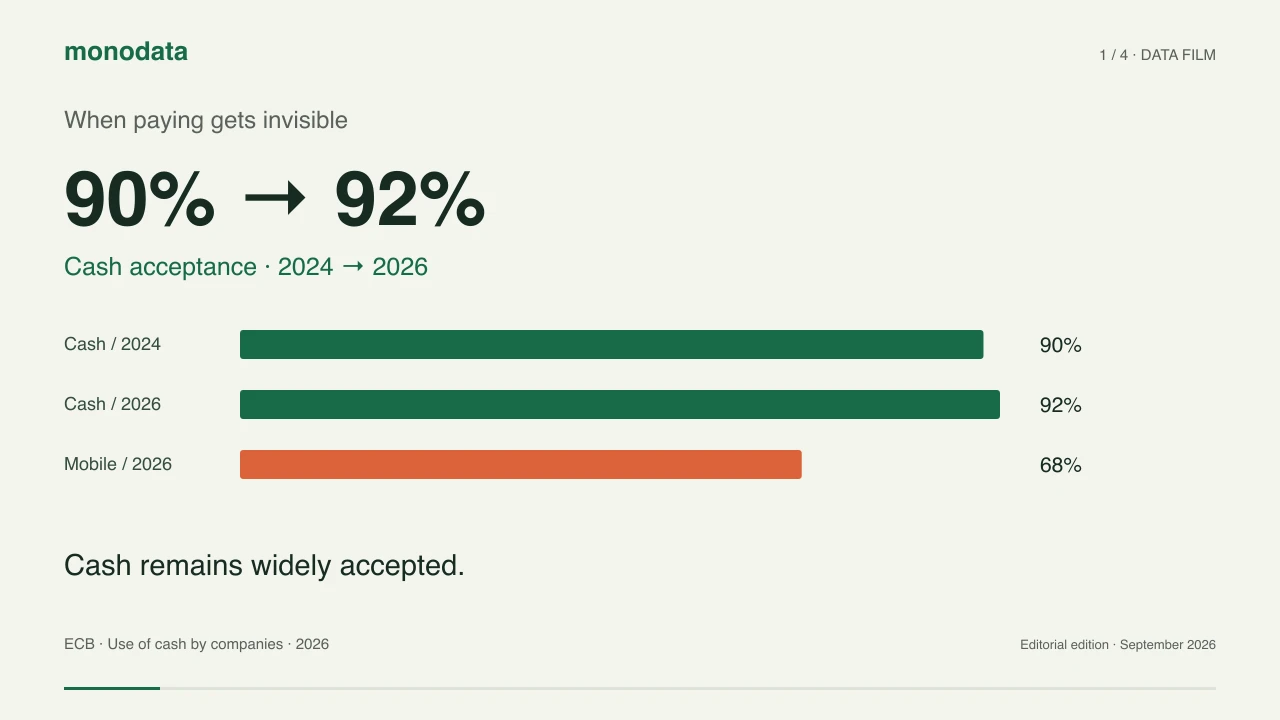
Mobile acceptance rose from 36% to 68%. Cash and digital can grow side by side.
2026
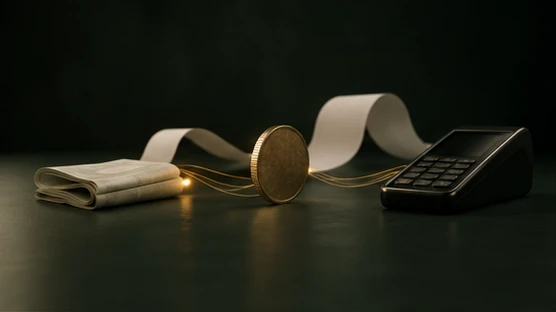
THE VISUAL STORY 01 / 05
THE MONEY YOU CAN FEEL
Cash has not left the counter.
In 2026, 92% of surveyed euro-area businesses with physical points of sale accepted cash.
That share was 90% in the harmonised 2024 comparison.
SOURCE-BACKED DATA
92%Businesses accepting cash
Euro area · 2026 survey
Hover, focus or tap a value to inspect it
AI-created frame sequence · scroll controls time · sourced dataScroll to continue
02 / PAUSE. MAKE A PREDICTION.
A business accepts cash and mobile payments. What share of its transactions must be cash?
An intuition is a starting point. The evidence is the reveal.
01
FOLLOW THE EVIDENCE
More digital does not mean less cash.
Businesses can accept several ways to pay. These percentages are not slices of a single pie.
Hover, focus or tap the data to see its context.
92%
Cash
2024 → 2026 +2 pp
88%
Physical cards
2024 → 2026 +1 pp
68%
Mobile payments
2024 → 2026 +32 pp
Acceptance is not usage. This survey measures companies, not the share of transactions consumers make with each method.
Source snapshot · September 2026
02
FOLLOW THE EVIDENCE
Available, used, valued: three different things.
The consumer diary reveals what people actually used. The perception survey reveals why they value an option.
Hover, focus or tap the data to see its context.
Cash use is declining
Share of point-of-sale transactions by number
But people still value it
Perceived advantages of cash over cards · 2024
2024 consumer survey and diary; separate from the 2026 company acceptance survey above. In 2024, 62% considered the cash option very or fairly important. Multiple perceived advantages may be selected.
Source snapshot · September 2026
03
FOLLOW THE EVIDENCE
The average has a geography.
Look at selected countries and sectors from the same study.
Hover, focus or tap the data to see its context.
2026 cash acceptance among SMEs with physical points of sale. The four countries shown are the high and low examples reported in the ECB summary; this is not a full ranking.
Source snapshot · September 2026
04
TRY THE MECHANISM
A tap is an entire system.
Switch off a dependency. See which payment path survives under the stated assumptions.
Card / phoneCan proceed
Physical cashCan proceed
Simplified payment-only model. Offline limits, device batteries, store operations, change availability and security controls vary. Cash cannot help if it was never withdrawn.
Assumptions are shown. This is not a forecast.Change an input. Watch what follows.
05
TRY THE MECHANISM
How much did you just spend?
Start with 100 units. Make four small purchases, then estimate what remains.
AVAILABLE100
Coffee6
1/4Assumptions are shown. This is not a forecast.Change an input. Watch what follows.
06
TRY THE MECHANISM
Spending less. Keeping value. Two questions.
A visible budget can help you track spending. Holding zero-interest cash is a different calculation.
0%60%
1 years10 years
PURCHASING POWER OF 10075.1
in today’s purchasing-power units
100 ÷ (1 + 10/100)3
Constant hypothetical inflation; no interest, fees or exchange-rate changes. This is arithmetic, not an inflation forecast or a recommendation.
Assumptions are shown. This is not a forecast.Change an input. Watch what follows.
 00:24
00:24THE SHORT FILM
When paying gets invisible
A visual explanation in 24 seconds. Watch, pause, look again.
Prepared once · shared by everyone · EN / TR captionsTAKE IT WITH YOU
What changes when you see the connections?
A visible balance can be a useful reminder. Keep the behavioural question of spending separate from the financial question of preserving purchasing power.