ONE QUESTION. THREE WAYS IN.
AN ATLAS OF EVERYDAY SYSTEMSEXPLORE · QUESTION · UNDERSTAND
03 / MARKETS & COLLECTIVE BEHAVIOUR
The risk
of standing still.
Knowing that a risk exists does not tell you when it arrives. Step through history, incentives and the mechanics of an exit.
Enter the timelineONE YEAR APART · S&P 500 TOTAL RETURN
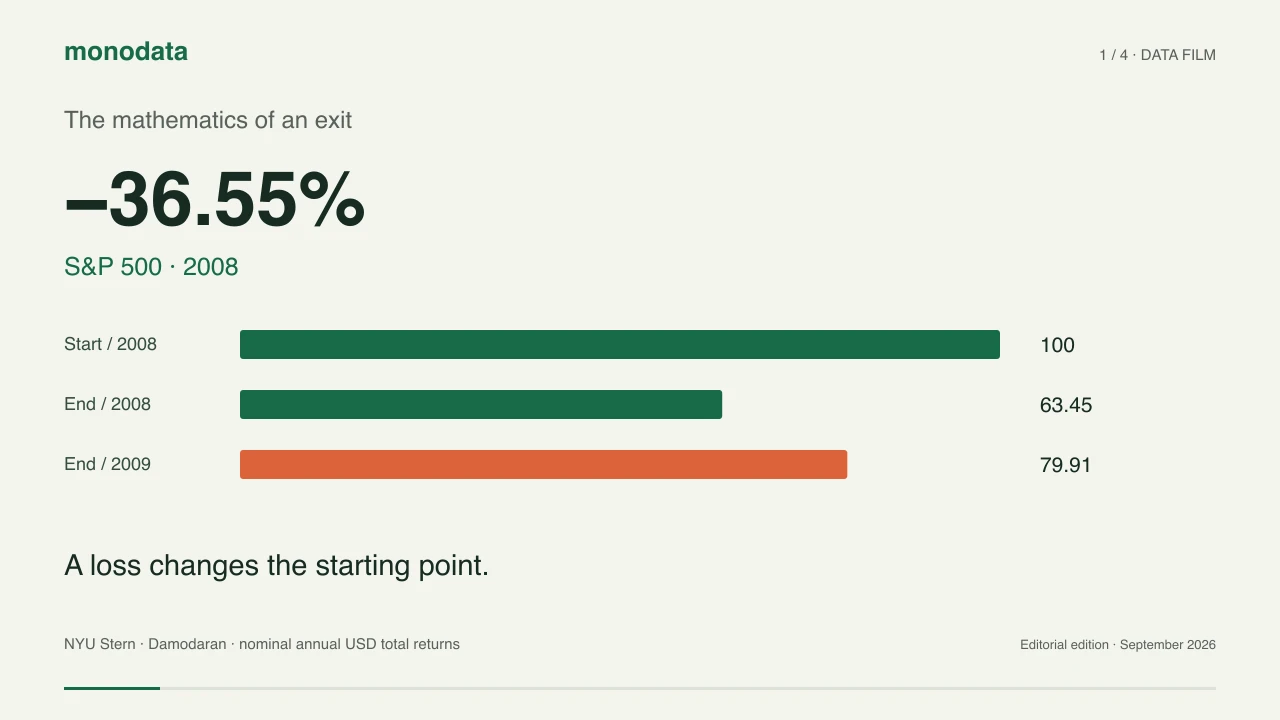
2008−36.55%
2009+25.94%
A rebound and a recovery are not the same thing. A 36.55% loss needs a 57.6% gain to break even.
Nominal USD · annual

THE VISUAL STORY 01 / 05
THE CROWD AND THE EXIT
The crowd sees opportunity before the exit.
Annual S&P 500 returns in 2023, 2024 and 2025 were positive in this historical series.
A rising market can coexist with uncertainty; returns alone cannot tell us why investors stayed.
SOURCE-BACKED DATA
3 yearsConsecutive positive annual observations
S&P 500 total return · 2023–2025
Hover, focus or tap a value to inspect it
AI-created frame sequence · scroll controls time · sourced dataScroll to continue
02 / PAUSE. MAKE A PREDICTION.
After a 36.55% loss, how much must an investment gain to return to its starting value?
An intuition is a starting point. The evidence is the reveal.
01
FOLLOW THE EVIDENCE
Your starting point changes the story.
Move the time window. Compare growth, yearly returns and the years a headline leaves out.
Hover, focus or tap the data to see its context.
End of periodStocks738.810-year Treasuries265.03-month bills164.3
Stocks738.8Worst year-end drawdown: 37.4%
10-year Treasuries265.0Worst year-end drawdown: 21.5%
3-month bills164.3Worst year-end drawdown: 0.0%
Nominal USD, dividends reinvested for stocks. Calculated from rounded annual data; taxes and fees excluded. Year-end observations cannot show the worst fall inside a year.
Source snapshot · September 2026
02
TRY THE MECHANISM
The future is hidden. Choose a year.
An annual decision exercise. Choose stocks or bills before revealing the next year’s return.
BEFORE THE YEAR BEGINS2007
Which exposure will you carry for the full year?
2007—Hidden
2008—Hidden
2009—Hidden
2010—Hidden
2011—Hidden
Always stocks100.0
Your choices100.0
Historical learning, not a strategy test. Dates may be familiar. No trading costs, taxes or within-year changes; the comparison uses identical years. One successful run establishes no forecasting skill.
Change an input. Watch what follows.
03
TRY THE MECHANISM
An exit needs someone on the other side.
Increase the sell order. Reduce available buyers. Watch the average execution price move.
501500
10100
10050
98100
96150
94200
92250
90300
88350
86400
84450
82500
AVERAGE EXECUTION PRICE97.33
against a best bid of 100
−2.67%slippage on filled units
300 / 300 filled
Ten fixed bid levels: prices 100, 98, …, 82; size at level k = depth × k. No new orders, spread, fees or market recovery. This model explains execution, not future market prices.
Assumptions are shown. This is not a forecast.Change an input. Watch what follows.
04
FOLLOW THE EVIDENCE
What the chart cannot tell you.
Separate the observation from the explanation.
Hover, focus or tap the data to see its context.
CONTEXTUAL EVIDENCE
Prices and returns are observable. They do not reveal why every investor acted. A 3.63% overnight US interbank rate in August 2026 describes the cost of short-term money, not investors’ confidence.
This dossier does not reproduce the proprietary fund-manager survey cited in the inspiration article. Historical returns and an interbank rate are different measures, not substitutes for that survey.
Source snapshot · September 2026
 00:24
00:24THE SHORT FILM
The mathematics of an exit
A visual explanation in 24 seconds. Watch, pause, look again.
Prepared once · shared by everyone · EN / TR captionsTAKE IT WITH YOU
What changes when you see the connections?
A good outcome does not prove a good prediction. Time windows, costs and the size of a loss change what a return actually means.