ONE QUESTION. THREE WAYS IN.
AN ATLAS OF EVERYDAY SYSTEMSEXPLORE · QUESTION · UNDERSTAND
01 / FOOD, WATER & RESILIENCE
The world
on your plate.
The smallest things on your table are connected to the biggest systems on Earth. Follow one ingredient.
Explore the connections5 scenes · explore at your pace
TÜRKİYE · DOMESTIC SUPPLY
4.2%
self-sufficiency
For every 100 units used domestically, usable production supplies 4.2.
2024–2025
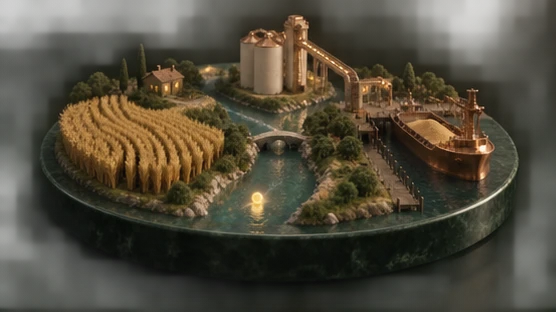
THE VISUAL STORY 01 / 05
FROM PLATE TO PLANET
A full plate is a system at work.
Behind an ordinary meal sit farms, water, storage and trade.
Türkiye produces only 4.2 units of soy for every 100 units it uses domestically.
SOURCE-BACKED DATA
4.2%Soy self-sufficiency in Türkiye
2024–2025 marketing year
Hover, focus or tap a value to inspect it
AI-created frame sequence · scroll controls time · sourced dataScroll to continue
02 / PAUSE. MAKE A PREDICTION.
For every 100 units of maize used in Türkiye, how much comes from usable domestic production?
An intuition is a starting point. The evidence is the reveal.
01
FOLLOW THE EVIDENCE
Self-sufficient in what, exactly?
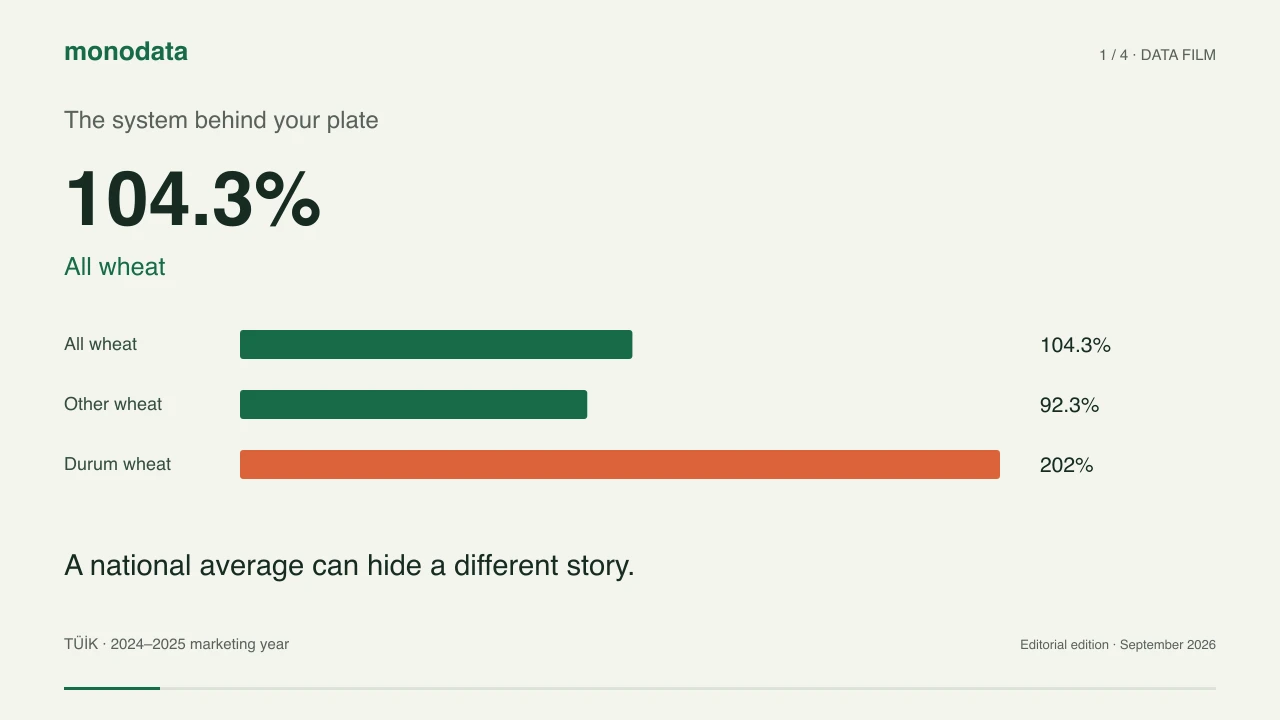
A national average can hide completely different realities. Compare the ingredients.
Hover, focus or tap the data to see its context.
THE REVEAL
Total wheat reaches 104.3%. But durum wheat reaches 202%, while other wheat is at 92.3%. A surplus in one category can conceal a gap in another.
A ratio below 100 is a production-use gap, not a measured import share. Trade, stocks and processed-product equivalents also matter.
Source snapshot · September 2026
02
FOLLOW THE EVIDENCE
One basket. Five different pressures.
Switch between the level of prices and the speed of change. They answer different questions.
Hover, focus or tap the data to see its context.
GLOBAL FOOD PRICE INDEX133.3
+1.9% month on month
16.8% below the March 2022 peakEach group is indexed to its own 2014–2016 basket. A higher index does not mean that one product costs more than another.
Source snapshot · September 2026
03
TRY THE MECHANISM
A field is only the beginning.
Open a link in the chain to see what a production number leaves out.
Conceptual supply chain · connections are not measured trade volumes
Inputs
Seed, fertiliser, energy and water arrive before the harvest. A productive field can still depend on outside inputs.
Change an input. Watch what follows.
04
TRY THE MECHANISM
Same volume. Different vulnerability.
Two hypothetical supply networks import the same 100 units. Close their largest supplier.
Supplier A70%
Supplier B20%
Supplier C10%
SUPPLY STILL AVAILABLE100/100
units, before any replacement
HHI 5,400 sum of squared percentage shares
Assumptions: equal demand, no stocks, no rerouting and no replacement suppliers. This exposes concentration, not predicted shortages or price changes.
Assumptions are shown. This is not a forecast.Change an input. Watch what follows.
05
TRY THE MECHANISM
Before the grain, there is water.
Keep the useful water fixed. Change how efficiently it reaches the crop.
40%90%
Withdrawn100.0
Useful at crop60
Other pathways40.0
WITHDRAWAL CHANGE−0.0%
relative to 60% delivery efficiency
60 ÷ (60 / 100) = 100.0units of water withdrawn
A normalised example, not a country estimate. Less withdrawal is not automatically a net basin saving: seepage may return to groundwater and farmers may expand irrigation.
Assumptions are shown. This is not a forecast.Change an input. Watch what follows.
 00:24
00:24THE SHORT FILM
The system behind your plate
A visual explanation in 24 seconds. Watch, pause, look again.
Prepared once · shared by everyone · EN / TR captionsTAKE IT WITH YOU
What changes when you see the connections?
The price tag is the end of a chain. Different ingredients can carry very different supply risks, even inside the same country.